
Part 2 of 2 - December Market Risk Update
- Matthew Ramer
- Dec 21, 2018
- 6 min read
Dear Clients & Friends,
Below is part 2 of this Weekend’s Reading: Brad McMillan’s Monthly Market Risk Update, which many clients have come to follow closely. Please make sure you first read our general market update sent yesterday, in order to get a broader perspective of our forecasts before we dive into the finer technical details herein. Markets are in panic mode and, as discussed in yesterday’s blog post, fear has set in. But fundamentals aren’t absolutely terrible. At least not yet. Let’s read what Brad has to say…
Economic shock risk
There are two major systemic factors—the price of oil and the price of money (better known as interest rates)—that drive the economy and the financial markets, and they have a proven ability to derail them. Both have been causal factors in previous bear markets and warrant close attention.
The price of oil. Typically, oil prices cause disruption when they spike. This is a warning sign of both a recession and a bear market.

A quick price spike like we saw in 2017 (it did not appear to reach a problem level and was short lived) is not necessarily an indicator of trouble. The subsequent decline also took this indicator well out of the trouble zone. Recently, prices rose again, approaching a level of concern. In the past couple of months, however, the price increase turned down. With the recent drawdown in oil prices, they are now even over the past year, suggesting no risk from this factor. Therefore, the indicator remains at a green light.
Signal: Green light
The price of money. I cover interest rates in the economic update, but they warrant a look here as well.

The yield curve spread narrowed a bit in November, as longer-term rates pulled back after a spike to post-2011 highs, but the spread remains well outside the trouble zone. As such, the immediate risk remains low. The fact that longer-term rates pulled back may be a cautionary sign, however. This narrowing, combined with more expected Fed rate increases, suggests the indicator remains something to watch. So, I am keeping this measure at a yellow light this month.
Signal: Yellow light
Market risk
Beyond the economy, we can also learn quite a bit by examining the market itself. For our purposes, two things are important:
To recognize what factors signal high riskTo try to determine when those factors signal that risk has become an immediate, rather than theoretical, concern
Risk factor #1: Valuation levels. When it comes to assessing valuations, I find longer-term metrics—particularly the cyclically adjusted Shiller P/E ratio, which looks at average earnings over the past 10 years—to be the most useful in determining overall risk.

The major takeaway from this chart is that valuations remain extremely high. In fact, despite recent declines, they remain close to the second-highest level of all time, exceeded only by the dot-com boom. Also worth noting, however, is the very limited effect on valuations of the recent increases in earnings due to the tax cuts. On a shorter-term basis, those earnings increases have markedly reduced valuations, suggesting reduced risk. On a longer-term basis, however, as shown in the chart above, valuations have not pulled back much at all. High valuations are associated with higher market risk—and longer-term metrics have more predictive power. So, this is definitely a sign of high risk levels.
Even as the Shiller P/E ratio is a good risk indicator, however, it is a terrible timing indicator. To get a better sense of immediate risk, we can turn to the 10-month change in valuations. Looking at changes, rather than absolute levels, gives a sense of the immediate risk level, as turning points often coincide with changes in market trends.

Here, you can see that when valuations roll over, with the change dropping below zero over a 10-month or 200-day period, the market itself typically drops shortly thereafter. Last month, valuation changes dropped into the risk zone. While the partial recovery in November seems to have stabilized this indicator, the December declines have taken us further into negative territory. I am keeping this indicator at yellow, as we have seen similar declines before without further damage. But rising risks mean I am adding a shade of red.
Signal: Yellow light (with a shade of red)
Risk factor #2: Margin debt. Another indicator of potential trouble is margin debt.
Debt levels as a percentage of market capitalization ticked up a bit. Although they are below recent levels, they are still quite high by historical standards. The overall high levels of debt are concerning; however, as noted above, high risk is not immediate risk.
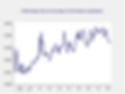
For immediate risk, changes in margin debt over a longer period are a better indicator than the level of that debt. Consistent with this, if we look at the change over time, spikes in debt levels typically precede a drawdown.

As you can see in the chart above, the annual change in debt as a percentage of market capitalization has ticked down again, moving below zero over the past couple of months. This indicator is not signaling immediate risk and, in fact, is showing decreasing risk. Still, the overall debt level remains very high. As such, it is worth watching, so we are keeping this indicator at a yellow light.
Signal: Yellow light
Risk factor #3: Technical factors. A good way to track overall market trends is to review the current level versus recent performance. Two metrics I follow are the 200- and 400-day moving averages. I start to pay attention when a market breaks through its 200-day average, and a break through the 400-day often signals further trouble ahead.

Last month’s declines took all three major U.S. indices below the 200-day trend lines and close to or slightly below the 400-day trend lines. This is not necessarily a sign of further trouble, but it is a sign that the risk of the trend turning even more negative has risen materially. The most probable case continues to be that the markets rebound and continue to rise, which has been supported by the recent partial recovery. But given the fact that both the Dow and the S&P remain below their support levels, risks of more volatility have increased. So, I am keeping this indicator at yellow with a shade of red.
Signal: Yellow light (with a shade of red)
Conclusion: Risks rising, conditions continue to weaken
After taking the market risk indicator to a yellow light for the first time eight months ago, markets have taken another downturn and violated some important support levels. The yellow light rating recognized that risks have risen, and the recent declines have exacerbated those risks.
The overall economic environment remains supportive, and neither of the likely shock factors is necessarily indicating immediate risk. But the continued volatility and the fact that several of the market indicators point to an elevated level of risk—combined with the ongoing policy concerns—suggest that volatility may get worse. I am not yet ready to go to a red light, given the supportive fundamentals. But the weakening market data does suggest conditions have gotten more dangerous.
As such, we are keeping the overall market indicator at a yellow light with a shade of red. This is not necessarily a sign of further trouble. Indeed, the likelihood remains that the market will rebound. Rather, it is a recognition that the risk level has increased even further over the past couple of months and that, even as the market recovers, further volatility is quite likely.

-Matthew
Matthew Ramer, AIF®
Principal, Financial Advisor
MOR Wealth Management, LLC
1801 Market Street, Suite 2435 Philadelphia, PA 19103
P: 267.930-8301 | c: 215-694-4784 | f: 267.284.4847 |
601 21st Street, Suite 300 Vero Beach, FL 32960
P: 772-453-2810
The majority of this content was written and distributed MOR Wealth Management, all rights reserved. Securities and advisory services offered through Commonwealth Financial Network, Member FINRA/SIPC, a registered investment adviser. Fixed insurance products and services offered through CES Insurance Agency.
Securities and advisory services offered through Commonwealth Financial Network, Member FINRA/SIPC, a registered investment adviser. Fixed insurance products and services offered through CES Insurance Agency. Certain sections of this commentary contain forward-looking statements that are based on our reasonable expectations, estimates, projections, and assumptions. Forward-looking statements are not guarantees of future performance and involve certain risks and uncertainties, which are difficult to predict. As stated above, commentary for the 5 risk factors provided by Brad McMillan and published in the Independent Market Observer. Past performance is not indicative of future results. Diversification does not assure a profit or protect against loss in declining markets. The S and P 500 Index is a broad-based measurement of changes in stock market conditions based on the average performance of 500 widely held common stocks. All indices are unmanaged and investors cannot invest directly into an index. The MSCI EAFE Index (Europe, Australasia, Far East) is a free float-adjusted market capitalization index that is designed to measure the equity market performance of developed markets, excluding the U.S. and Canada. The MSCI EAFE Index consists of 21 developed market country indices.